Subjective ratings of frequency and importance.
Some interaction / Information Architecture design minutiae today. How closely do user ratings of the importance of a feature equate to ratings of frequency of use of that feature?
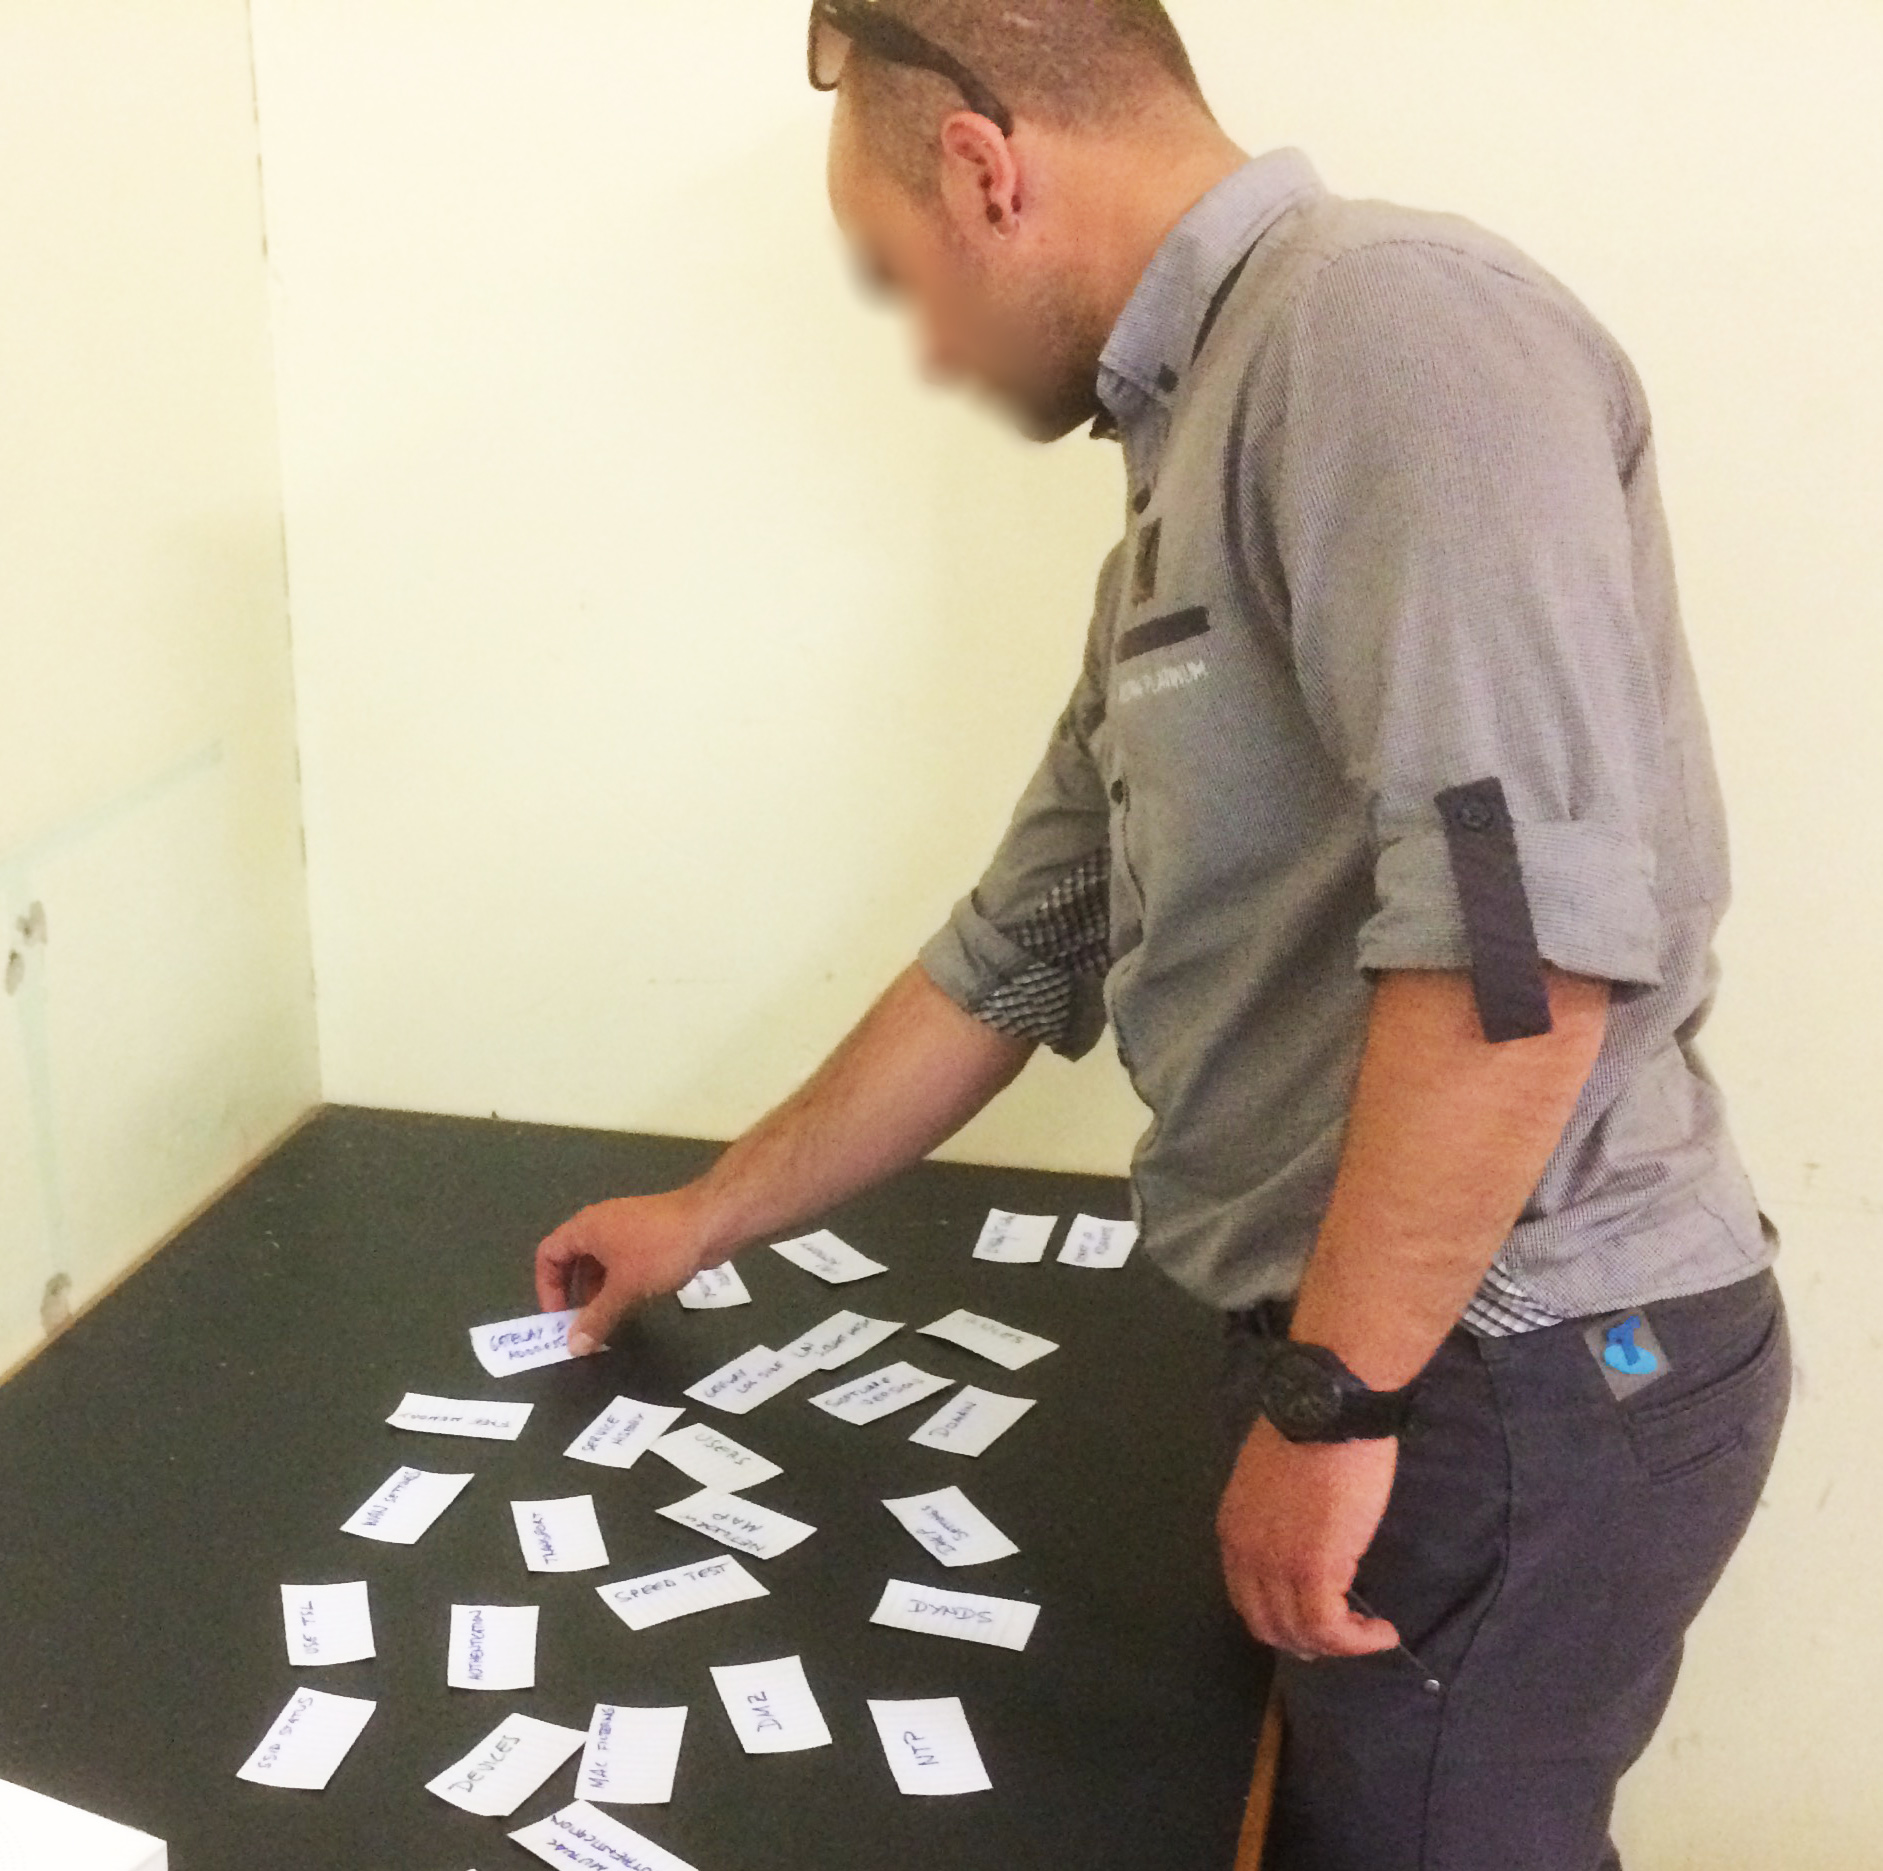
So I was recently asked to validate the IA of an existing product and then fold these findings into the design process for a new product. The product was a mobile and tablet app for field technicians working for a major Australian tech company. So I carried the usual card sorting exercises (this time in the field, while doing ethnography at the sites of the technician’s work – super interesting) and, as usual, learned some cool information that provided clear direction for the development of the IA. Cool. Once the new product had been designed, some questions (and, as usual, stakeholder arguments) remained over the prioritisation of functions – whether certain things should be promoted to level 1 of the IA or left to languish on lower levels, with more actions required to get to them.
So the obvious approach here is to gather data on the relative user value of these functions. But suddenly a theoretical chasm opened. In prioritising within IA – what does one measure? The frequency with which a feature is used or the perceived importance of a feature when it is used? And are these the same thing?
There are a number of frameworks one could apply here. Transcending the feature mind-set and focussing on user tasks, developing a matrix, or a simple little formula that operationalizes variables such as business needs and technology requirements, etc…. But in the end I thought, this is one area in which users are likely to have a pretty accurate picture of what is important. They will know the features they need to use every day in their work – in particular because they have used all these features before – albeit using different tools.
So to validate this concept (and meet the client goals of prioritising features) I put a survey in the field asking representatives of the user-base to submit rankings for each the six primary IA functions according to both perceived Importance as well as Frequency of use.
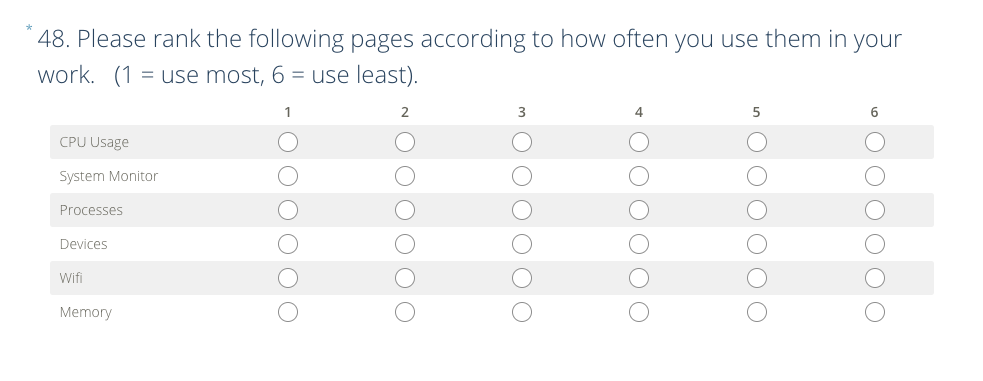
Note: the survey software randomised item order, required a rating for each one and, on inspection, responses appeared not to exhibit any obvious rapid completion biases.
And the results were super interesting.
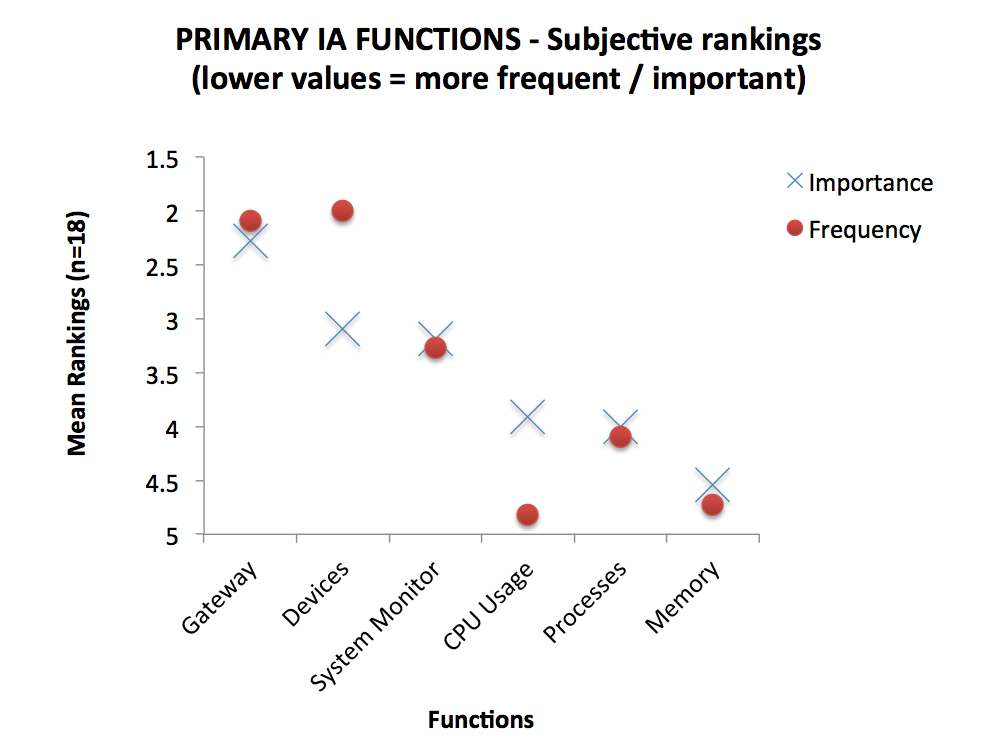 As you can see there is a LOT of agreement between ratings of Importance and frequency. In fact, if you throw this data into some statistical software and for the correlation of Importance and Frequency ratings, you get a Pearson’s co-efficient of r= .891 with a p score of .009 – which is to say – there is an incredibly high likelihood that these two scores are highly positively correlated.
So what does this all mean? It means that, here, at least, is one area where we can trust our users. When we ask for something’s importance – users will be instinctively integrating a whole host of information they have acquired about using a tool in a specific domain – and will quickly produce a result that includes estimations of frequency of use. I wonder what other variables lie hidden under the surfaces of the glib, overarching concept of ‘importance’.
 Address: 11 Silva St, Tamarama, Sydney, Australia
 Phone: +61 2 (0) 404 214 889
 Email: